Reforming the Energy Vision (REV) is Governor Cuomo’s plan to “rebuild, strengthen and modernize New York’s energy system. The ultimate goal of REV is to change the energy system of New York to reduce greenhouse gas (GHG) emissions 80% from 1990 levels by 2050 (“80 by 50”). This post summarizes the status of NY emissions and energy use.
The New York State Energy Research and Development Authority (NYSERDA) Patterns and Trends document provides both CO2 emissions and energy use data but I used the NYSERDA New York State Greenhouse Gas Inventory and Forecast report for Table 1 New York GHG Emissions, Historical and Targets. According to the Inventory report 1990 NY total GHG emissions were 235.8 million metric tons of Carbon Dioxide equivalent (CO2e). I assumed that was the total emissions used to calculate the reductions necessary to meet the 80 by 50 goal. However, note that fuel combustion accounts for 205.8 million metric tons. There is another category for “other” sources including CO2 from municipal waste combustion, cement production, limestone and soda ash use, and iron and steel production; methane, nitrous oxides, perfluorocarbons, hydrofluorocarbons and sulfur hexafluoride emissions. The report also mentions that energy-related emissions, a category calculated as part of New York’s State Energy Plan that includes fuel combustion, net electricity imports, power supply & delivery, and natural gas leakage were 212.87 million metric tons.
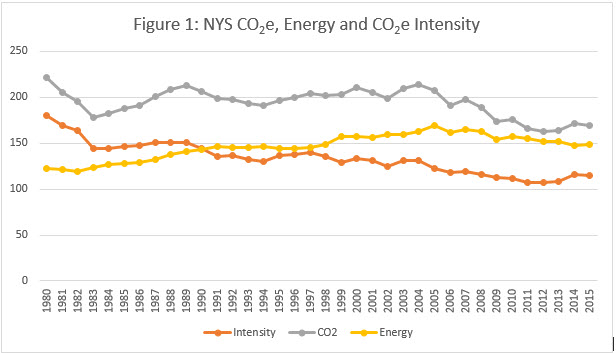
Figure 1 shows the trends in New York State CO2e emissions, energy (TBtu) and CO2e intensity which is the emissions divided by the energy. Note that the energy used in New York rose until 2005 and has since started to drop while the pattern of CO2e has ebbed and flowed more but has also dropped since 2005. In order to determine the viability of the 80 by 50 goals it is necessary to look at what drove those trends.
In order to reduce GHG emissions there are three direct approaches:
- Replace energy sources that generate GHGs with ones that don’t
- Energy efficiency – use energy more effectively
- Energy conservation – use less energy
In addition there are a couple of indirect ways: reduce the population and reduce the gross state product or economic growth. I mention those two methods to point out that neither approach is politically palatable as an approach to reduce GHG emissions and that historically the gross state product has increased and population has stayed relatively constant.
The NYSERDA Patterns and Trends document contains the energy and emissions data by sector needed to evaluate the causes of the observed reductions. Figures 2 and 3 show the trend of primary energy consumption by the residential, commercial, industrial, transportation and electric energy production sectors by total energy use (TBtu) and % of total. Residential has bounced around but is effectively the same since 1080 and the commercial sector trended up but has trended down to roughly the same levels as 1990. Given the growth in the economy it appears it appears to me that investments in conservation and efficiency have produced some results. The most notable decrease has been the industrial sector, down over 200 TBtu since 1980. While efficiency and conservation have helped with that it is more likely a result of the decline of the industrial sector in New York. Transportation energy use has grown consistently since the mid-80’s. The electricity sector grew until approximately 2005 and has since dropped. It does not appear on the basis of historic trends that energy conservation and energy efficiency will be major factors for compliance with the emissions goals.


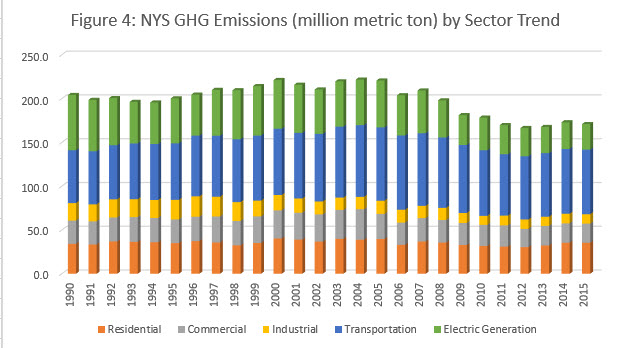
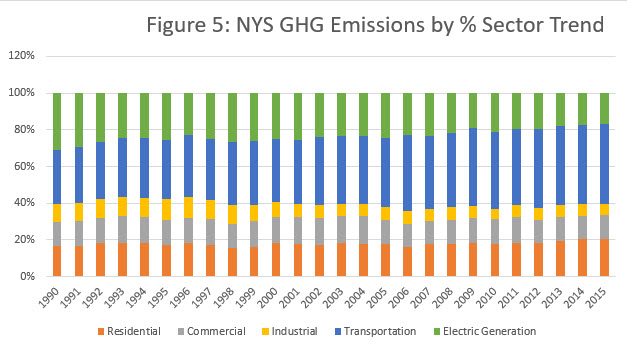
That leaves carbon emission reductions to make the majority of the reductions necessary. Figures 4 and 5 show the trend of GHG emissions by the residential, commercial, industrial, transportation and electric energy production sectors and % of total. Note that these are emissions from fuel combustion only so the totals are not the same as shown before. The emissions trends for residential, commercial, industrial and transportation sectors are similar to the energy trends. Residential and commercial are roughly the same, industrial is down, and transportation is up. Electricity sector emissions are down more than the total energy.
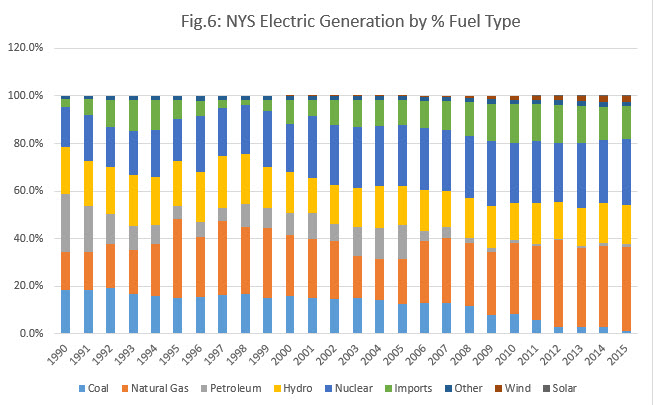
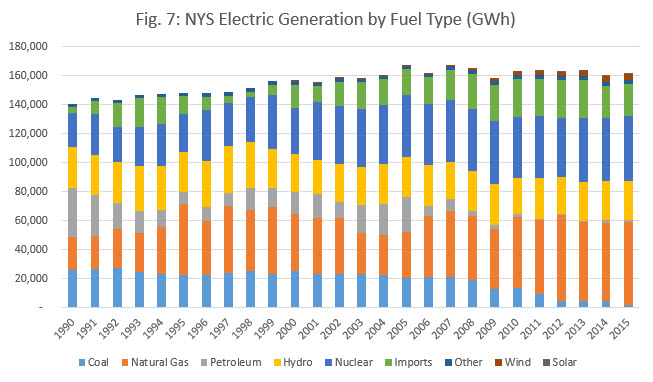
Renewable wind and solar energy are supposed to make major contributions to the emissions reductions necessary for the 80 by 50 goal. As a result, we need to evaluate the sources of electricity generated in New York. Figure 6 shows the percentage of electricity provided by different sources: coal, natural gas, petroleum (residual oil and distillate), hydro, nuclear, imports, other (landfill gas & biomass), wind and solar. Coal and petroleum have gone down significantly since 1990. Natural gas has increased significantly as has imports. After Nine Mile Point unit 2 came on-line nuclear has stayed about the same as has hydro. In the past few years enough solar and wind have come on line to appear on the chart. Figure 7 shows the total energy provided by the same categories. Clearly the biggest changes have been the reduction of coal and petroleum fuel use and increase of natural gas and imports.
In order to determine how much carbon free renewable energy can directly affect CO2e emissions we need to look at the electric sector emissions relative to emissions from the rest of New York State. Figure 8 shows the trends and Table 2 NYS Combustion Source CO2 Emissions by Electric Sector and Rest of State shows the data. Statewide coal and electric sector oil have gone down 55 million metric tons but since 1990 natural gas has gone up. It can be argued that for the most part the major decreases in coal and oil were the result of changes in the relative cost of fuel and had nothing to do with New York State policy. Moreover, the State has drafted regulations to eliminate the use of coal so renewable energy deployment will not drive further emissions reductions from coal and there are only 3.9 million metric tons of reduction available anyway. With respect to electric sector emissions, no further oil use reductions are expected because the current levels represent the minimum emissions necessary to maintain oil as a backup and emergency use fuel. That leaves natural gas emissions.

Overall, the total emissions in 2015 are only down 18% from 1990 levels to 169.5 million metric tons and the 2030 target is 141.5 million metric tons so further reductions of 28 million metric tons are necessary in the next 15 years. If renewable energy sources completely replaced fossil emissions that would provide reductions of 29.2 million metric tons. There are significant technological hurdles to doing that so I believe that is an unrealistic goal. On the other hand the primary way to reduce emissions from the other sectors is to replace fuel combustion with electricity. The great challenge of REV is how to meet that additional expected demand without increasing CO2 emissions
